The phase lag between the external excitation of the vibrating probe and its response to the tip-surface interactions, referred to as phase shift, is related to the local energy dissipation on the surface. Specifically, the sine of the phase shift f is proportional to the amount of inelastic energy transferred from the tip to the sample surface (Eq. 2). Although energy dissipation is often associated with irreversible sample deformation, in AM-AFM the energy could be dissipated in a gentle and wearless manner that does not involve sample modification and, therefore, it is compatible with nanoscale spatial resolution. As in the case of the exerted force in the sample, the value of the dissipated energy depends on both experimental parameters and tip-sample inelastic processes. Typical high resolution experiments involve dissipated values per cycle in the 0.5-50 eV range. For a spatial resolution of 2 nm, those values imply a dissipated energy per bond that ranges from 0.001 to 0.1 eV, i.e., far less than the bonding energies of most materials.
Scheme of amplitude modulation AFM with topography and compositional sensitivity
In amplitude modulation AFM a topographic image is generated by scanning the tip across the surface while keeping the oscillating amplitude at a fixed while. The application of the virial theorem to the tip motion enables to derive a relationship between the amplitude A and the average value of the conservative tip-surface forces <Fts>

Equation 1 shows that any type conservative force will reduce the amplitude from its free value (A0). Equation 1 is only valid for w=w0. F0 is the external force that drives the tip oscillation.
Separation of topography and composition arises because in the steady state operation of the microscope (z=z0+A cos(wt-f)) the average energy released by the cantilever to the medium Emed (air or liquid) and the sample surface must match the average energy supply by the external driving force. Then, the phase shift lag f between the microcantilever excitation and the probes response is related to the oscillation amplitude A and the average energy dissipated in the sample Edis and in the environment Emed by (w=w0)

The prefactor (A/A0) and Emed remain constant during amplitude modulation AFM imaging (A=constant). Consequently, any change of the phase shift is directly related to a local change in the energy dissipated in the sample and independent of the topography. The oscillation amplitude is kept constant by the feedback system with only small instantaneous variations because of the finite response of the electronics. The influence of those variations on the phase shift is negligible in first approximation. The phase shift of the oscillation with respect to a reference value tracks composition variations.
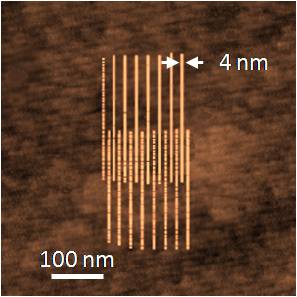
Parallel array of polymer wires fabricated by AFM nanolithography on a silicon surface. The phase image (right) enables to characterize the continuity of the wires with 3 nm resolution. The phase imaged enables to detect compositional variations along the wires with a spatial resolution of 3 nm. Those variations are unnoticeable in the topography image.
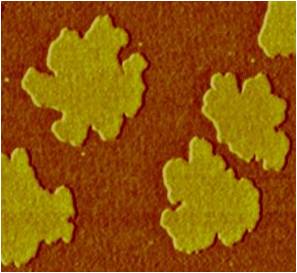
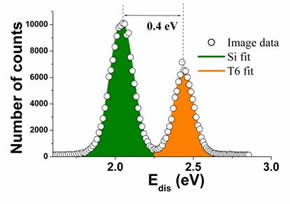
Phase-imaging force microscopy images of several T6 monolayer islands deposited on silicon. (d) Energy dissipation histograms extracted from (c). The number of counts is larger on the silicon surface because at the present coverage its surface area is larger.
Phase imaging in liquid
In liquid the quality factor of the cantilever is small Q (~1-5), the higher harmonic components of the oscillation could have a non-negligible contribution on the tip motion, then Eq. 2 should be modified. If the first two higher harmonics (A1, A2) are the dominat components of the oscillation, z=z0+A1 cos (wt-f1) + A2 cos (2wt-f2), it can be shown that (w=w0),

Equation 3 is derived by applying a methodology similar to the one used to obtain Eq. 2. The above result says that for small Q values, a complete separation between topography and dissipation is not possible. Nonetheless, Eq. 2 remains a good approximation whenever A1>40A2. This is usually the case in many AFM experiments in liquids.
Nanoscale energy dissipation and sample properties.
The sine of phase lag between the external excitation and the tip response is directly linked to the amount of energy dissipated on the sample (Eq. 2). On the other hand, several analytical relationships between the dissipation and sample properties such as surface adhesion energy, elastic modulus, stiffness, plasticity index or viscoelasticity have been derived. For example, lets take the case of a dissipative process characterized by surface adhesion hysteresis, i.e., when the work needed to separate two surfaces is always greater than the originally gained by bringing the surfaces together. Then the dissipated energy is proportional to differences in surface energies,
![]()
where δ is the deformation (indentation) and FDMT is the Derjaguin-Muller-Toporov (DMT) forces in approach and retraction half periods;γr and γa are respectively the approach and retraction surface energies and R is the tip radius. Equations 2 and 4 allow the observer to turn AM-AFM observables such as phase shifts into material properties. Figure 2 shows the agreement obtained between experiments and theory for two different inelastic processes, surface adhesion hysteresis and viscoelasticity. Ultimately any dissipation process can be described by the existence of a hysteresis in the force versus distance curve, i.e., the force while the tip approaches the surface differs from the force when the tip retracts from the surface. At the atomic scale ab initio calculations show how this hysteresis is linked with the molecular deformations induced by the tip-molecules forces. These force difference is described at the nanoscale by the hysteresis in the adhesion energy.
To know more about Phase Imaging AFM from Garcia’s group
- R. García, C.J. Gómez, N.F. Martínez, S. Patil, C. Dietz and R. Magerle, Physical Review Letters 97, 016103-4 (2006)
- R. García, R. Magerle, R. Perez. Nature Materials 6, 405-411 (2007).
- N. F. Martínez and R. GarcíaNanotechnology 17, S167-S172 (2006)
- Nicolás F. Martínez, Wojciech Kaminski, Carlos J.Gómez, Cristiano Albonetti, Fabio Biscarinni, Rubén Pérez and R. García. Nanotechnology, 20, 434021(2009)
- Javier Tamayo and Ricardo García. Applied Physics Letters 71, 2394 (1997)
- Javier Tamayo and Ricardo García Applied Physics Letters 73, 2926 (1998)
- Amir F. Payam, Jorge R. Ramos and Ricardo García. ACS Nano 6, 4663-4670 (2012)